

By Camilla Fratta, Ananya Jain, Sydney Mason, Gabby Matejowsky, and Nevaeh Pinkney*.
*Nevaeh helped the group work through the problem set but was unfortunately unable to attend camp during the blog writing.
Mathematical Epidemiology explores the realm of mathematics applied to public health. It relies on modeling to use known information about certain scenarios regarding the spread of diseases and then uses it to predict future outcomes. By the end of the problem set, our group learned about the challenging process that comes with trying to predict population sizes in order to control the spreading of diseases. The equations that are faced in this branch of mathematics are at the heart of mathematical modeling.
Mathematical Models and Modeling
A mathematical model is an equation used to predict or model the most likely results to occur in a real-world situation. We used these types of equations to model the spread of a disease in a population, tracking the flow of populations from susceptible to infected to recovered. In real life scenarios, there are too many variables to fully account for, so we only were able to place a few in our equations. This made the models less accurate, but at the same time very useful to us in our problem set. They gave us a good idea of how things worked in an actual epidemic and helped us to understand what mathematical modeling really is.
Linear and Nonlinear Population Models
Linear models and nonlinear models are best used to show growth in a simple way. The graphs of these models are used to predict growth in population. The population in question might be an actual population or a certain group, maybe a group of people infected with some kind of disease, etc.
Linear graphs are represented by straight lines and increase at a constant rate. Exponential graphs are curves where the curve continues to steepen. A logistic graph is also curved but at the end it plateaus making the top flat, which means it’s reached its maximum capacity. Each graph would have it pros and cons. While the linear model might not be extremely accurate, it is very simple to understand. Exponential graphs show what growth can be at such an extreme rate. Logistic graphs show a realistic graph where the population has a maximum capacity.
Modeling Disease Spreading
The second section that mentioned mathematical modeling asked us to create equations that came up with sizes for the populations listed in our SIR model: Susceptible (S), Infected (I), and Recovered (R). We had to consider factors that would make the populations increase or decrease, based on the information provided for our scenario.

The scenario established that within 12 hours of a first infected person’s arrival in Los Angeles, 20 people were diagnosed with the virus, and 30 more had symptoms. 36 hours later, 240 more people were diagnosed and 360 had been experiencing symptoms. From these amounts, we were given the following equations:

Then, we had to understand the variables in the equations provided to find the transition rate of populations and how these affected the various groups. This encompassed five questions. We very much had to use our previous knowledge of mathematical modeling to figure these out.
Introduction to Differential Equations
The beauty of differential equations is that they can calculate the rate of change of a model from any instant to another. This allows the resulting model to be more precise and accurate, unlike using discrete time blocks (as we had been doing with 12-hour blocks increments).
In the problem set, when we worked with the recursive equations, we went from years to months, to days, to twelve-hour blocks; now, using differential equations, we are able to be as precise as we want, even to the millisecond. To do that, differential equations use derivatives. But what do differential equations and derivatives look like? On the next page we had our answer:

These equations look identical to the previous ones except for what is on the left of the equal sign, the fractions. The fractions threw us off, but then we learned that those were the time derivatives. The time derivatives allow you to calculate at any instant the population changes. That’s the superpower of differential equations that we really appreciated.
Modeling in Python
This part of the problem set was done with the aid of a computer – let us rephrase that -the computer did all the work. We had a applet already created in Python, and all we had to do was plug in the variables and parameters. With this program, we were able to see how just a little change in the information would drastically change the result. Since it used differential equations, we could decide how precise the instants were. The first one we tested was the 12-hour blocks we used for the paper version, and we saw that our calculations we correct! 😊
Adjusting the Model
Even though the SIR model is very useful, it can be made more accurate. The SEIQR model is more complicated but more accurate. It stands for Susceptible, Exposed, Infected, Quarantined, and Removed.
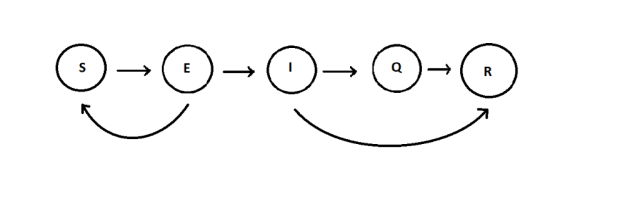
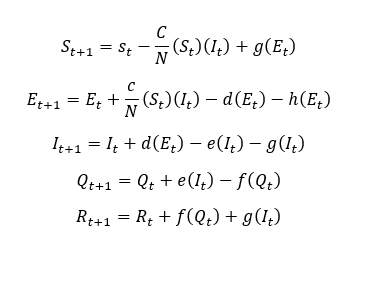
This new model means that people don’t always move through the chart the same way. People can move forward, skip steps, or even move backward. This means that we need new equations to make the model accurate.
Conclusion
In the end, after the two weeks of studying mathematical epidemiology, we took valuable lessons away with us. We learned that when reading texts concerning the field, it is normal to read a single sentence or a passage several times to comprehend it properly. We learned to never trust the author and to check every claim and calculation. We also learned to take our time and never give up. Many of our group members would love to take mathematical epidemiology and applied mathematics to further stages in our lives and, as always, we will continue talking math!
Cover picture: the Math Maticals at work on the Mathematical Epidemiology problem set.
