
By: Kathryn Benedict, Kate Allen, Sarai Ross, Rosy Nuam
Girls Talk Math is an all girls camp that introduces new topics that students would not normally see in their everyday math class at school. This camp also brings together many young women to better explore a field that is male dominated. During this camp we were able to research many important women that we able to make their own legacy while facing much adversity along the way. The camp wants to show not only the campers but also other women going into the field of math and science to not be afraid due to the gender difference, but instead use it as motivation to carry on doing what you love and making your own legacy along the way.
Our group consisted of four young women. Kathryn is a rising sophomore at Cedar Ridge High School. Kate is a rising sophomore at Carrboro High School. Sarai is a rising junior at Northern Vance High School. Rosy is a rising senior at East Chapel Hill High School.
In the Scientific Computing group, we were able to use a coding program called Mathematica, which allowed us to type code to run more complex calculations that would normally be too hard to compute by hand. Our group worked on different recurrence relations, which are a sequence of numbers in which the value of each term in the sequence depends on the values of previous terms in the sequence. One example of recurrence relations that we worked on was the Fibonacci sequence. The Fibonacci sequence is a series of numbers in which each number is the sum of the two numbers that come before it. The Fibonacci sequence is 1, 1, 2, 3, 5, 8, 13, … It is calculated by adding 1 + 1 = 2 then 1 + 2 = 3 and so on. We also worked on the Golden Ratio, which is derived from the Fibonacci sequence, and the Mandelbrot Set. The Mandelbrot Set is different images made by sampling complex numbers and determining if the numbers tend towards infinity when performing the mathematical calculations. The last problem we worked on was showing population growth in a community of rabbits and coyotes. The population was modeled by different equations and graphs used to show the growth or decay of the rabbit population based on different factors around it.
The Golden Ratio is found through the Fibonacci Sequence. When one divides the current term by the previous term (for example, dividing 3 by 2), a value close to the Golden Ratio is produced. As the Fibonacci Sequence grows larger, this output becomes closer and closer to the Golden Ratio. We wanted to determine the Golden Ratio by editing our Fibonacci program in Mathematica. After implementing the new function, an/an-1, we ran the program and were able to create a graph of these values. We were also able to see these values numerically.
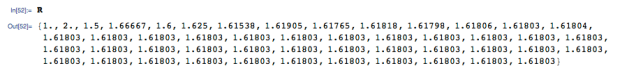
Our numerical values from Mathematica

Golden Ratio graph
One can observe that after a brief amount of time, the output levels off at the Golden Ratio, which is about 1.61803.
For one of our last problem sets, we worked on the growth and decay of the rabbit population. We represented this growth/decay in multiple different graphs, the first representing the exponential growth of the rabbit population without any outside factors to hinder the reproduction.
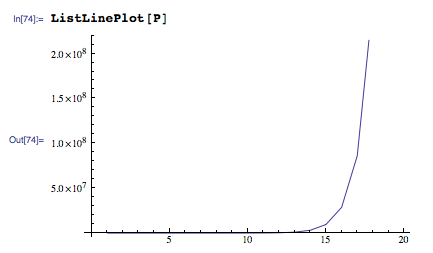
As you can see, the rabbit population grew very quickly and had no other factors, such as coyotes or food shortages, to slow and/or stop the rapid growth.
Our next equation, called the Verhulst Equation, produces a graph that was able to represent the rabbit population more accurately because it took into account different limiting factors. This equation factored in things such as not having enough food and having different predators limiting the rabbit growth. There is also the fact that rabbits have their own lifespan, so some rabbits would die off in the later generations. This equation was able to compute a graph so that we can better understand the limiting factors influencing the rabbit population.
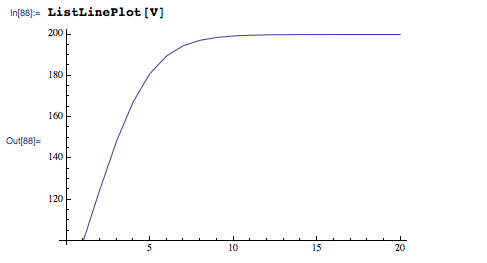
As one can see, the rabbit population did not continue to grow exponentially. There is another factor, called the carrying capacity, that states the rabbit population, or really any animal population, can not exceed a certain number of offspring due to not having enough space or food, having predators, and any other factors that may be presented as a problem to the rabbit population. This graph clearly shows the population increase very quickly but then level off at the carrying capacity of 200 rabbits.
The final equation we tried was called the Logistic Map equation. At first glance, it looked similar to the Verhulst Equation, but the results were quite different. The Logistic Map equation is equal to 1 – the initial population.That value is multiplied by C, the fertility factor, times the initial population. It produces a very interesting graph that is better at exhibiting complex behavior than the other graphs we used.
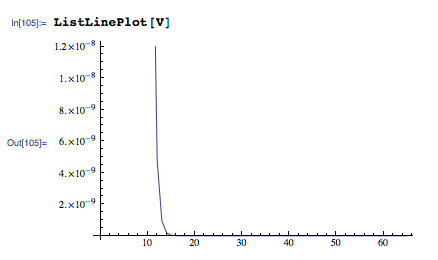
Logistic Map graph
When different values of C are tested in the equation, a new graph can be made to properly model the data. The points on the graph have an x-coordinate of the C value that was tested, and the y-value is any repeated values that come up when the equation is solved with C. This is called a Bifurcation graph. Our bifurcation graph wash’t perfect, as it could only go so many values out due to our computer’s capabilities. Thus, it was much simpler than true Bifurcation graphs. Below is a GIF showing how it would look if it was made correctly.
We also did a problem on the Mandelbrot Set. This was our last problem set that we completed due to the long and complicated process. There were many coding processes that we had to go through that would be hard to explain, but we still wanted to show you our end results to get a slight understanding of what the Mandelbrot Set looked like. These were definitely very amazing pictures that we were very happy to have seen as the outcome of our long coding process. The images modeled numbers in the Mandelbrot set and plotted them for a visual representation.
These are the first pictures we obtained from the original Mandelbrot code. The only difference is that we were able to change the colors seen in the image, which explains the difference in the two images below.


This is one of the pictures we saw when zooming out of the original image.
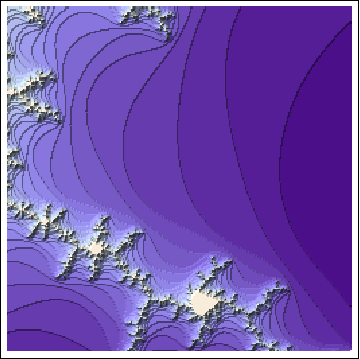
There is one other image that we would like to show you which is another variation of the image seen right above.

In conclusion, Girls Talk Math was able to bring together many young women to celebrate their love of math while meeting new people and learning along the way. This camp was able to teach young women the ways of math while also teaching them about other women mathematicians and scientists in the effort of showing us that women are smart individuals that can also pave a way into new ideas just like the men around us. As the readers can see, there was a lot of math involved but in the end it was worth it when seeing the pages of code and graphs that were the product of our amazing work. Our group was able to learn more about the art of coding while computing the Fibonacci Sequence and Mandelbrot Set, something we would never have learned during the regular school day. This camp really opened our eyes to the other women mathematicians and their impacts while also showing us real life problems in which math can help us solve very complex equations. Our group can definitely say that Girls Talk Math was an amazing experience and we can now walk away feeling more confident about our abilities and having a deeper understand of math as a whole.
Check out our podcast on Ada Lovelace at https://soundcloud.com/girls_talk_math/ada-lovelace!
