

By Cameron Farrar, Elizabeth Gross, Shiropa Noor, and Rebecca Rozansky
Girls Talk Math was an eyeopening experience to a brand new world of mathematics. Over the past two weeks, we have been introduced to multiple topics and related professions. We learned about: quantum mechanics, surface classification, knot theory, computing & dynamics, elliptic curve cryptography, RSA encryption, special relativity and the most interesting of them all- NETWORK SCIENCE!
During our time at Girls Talk Math, we learned about the wonders of network science and graph theory. The difficult part of this otherwise enjoyable journey? Mathematica. Mathematica is a software created to make you suffer, especially if you already know computer science (AHEM BECKY). Basically, we created graphs, did calculations and got confused on Mathematica. Typing out all the commands took ages. We’ll show you some examples as we go through the different concepts we explored. Don’t worry- once you spend some time on Mathematica, you’ll get used to it.
Graph Theory
Graph theory is the mathematical study of graphs. A graph is made up of nodes, and nodes that are related to other nodes are connected by edges (think of vertices and line segments). If meaningful data or relations are represented by the graph, then it is called a network. The terms “graph” and “network” are often used interchangeably.
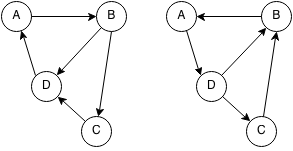
A B C and D are the nodes. The edges are AB, AD, BD, BC, and CD. Order doesn’t matter- DC is the same as CD.
A graph is disconnected if it can be divided into components.
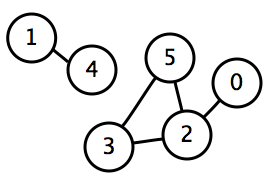
Nodes 1 and 4 are not connected to the rest of the graph and they are a separate component.
The number of edges a node has corresponds to the node’s degree. For example, node 5 has 3 edges so it has degree 3. Nodes A and C are degree 2, while nodes B and D are degree 3.
Euler Paths and Circuits
In the late 1700s, Leonhard Euler was posed with an important question about the bridges in Königsberg, Prussia. A map of the city showed the seven bridges and land masses that they connected, and Euler was asked: is there a route in the city that made it possible for a person to cross each of the seven bridges once and only once ?


Looking at the map on the left, we drew the graph on the right. The land masses are the nodes and the bridges are the edges.
With this problem, Euler paths and circuits were discovered. A graph has an Euler path if it has two or less nodes with odd degrees. A graph has an Euler circuit (also called an Eulerian cycle) if there are no odd degree nodes- all the nodes have even degrees. Graphs that have either Euler paths or circuits allow each edge to be crossed only once. Because all four nodes in the graph have odd degrees, it isn’t possible to cross each bridge in the city only one time.
The Prison Cells
Now that we know only Euler paths and circuits allow edges to be crossed once and only once, we looked at some other problems. If you’re ever stuck in prison and can only escape if you walk through each door only once, this is for you!
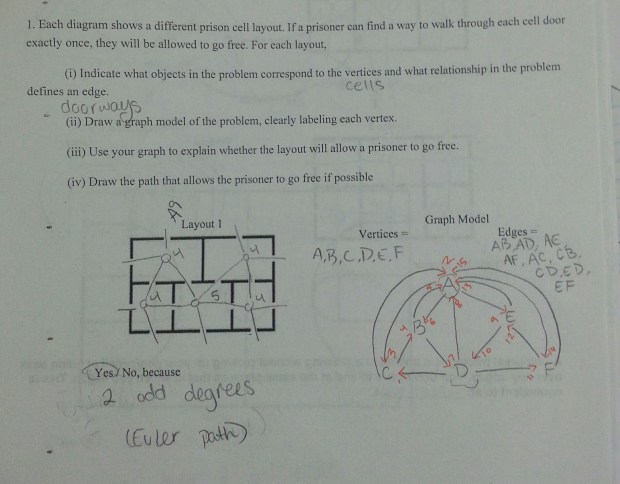
You probably noticed all the orange arrows we drew on our graph. We tried to solve this problem- can the prisoner go through each door only once- on our own, without considering what we had just learned. Instead of checking for an Euler path or circuit in this graph, we mapped out a route for the prisoner that allowed him to walk through each door only once and escape. We quickly remembered that counting the degrees of each node and checking for Euler paths and circuits was a much faster method for solving this problem.
Random Graphs
Network theory is the application-based study of graphs and many of these studies involve random graphs. Random graphs are generated from probabilistic calculations.
Erdós-Renyí
An Erdós-Renyí (ER) graph randomly places m edges between n nodes and is denoted by G(n, m). One use of an ER graph is to study how a disease can spread amongst people when only a few of them are infected.

Both these graphs have 18 nodes and 20 edge- but they’re completely different! This is because edges are randomly assigned to nodes in ER graphs.
Now we can look at degree distributions of ER graphs. The probability of having degree d goes on the vertical axis and the degrees of the nodes go on the horizontal axis. With ER graphs, there is a narrow degree distribution centred around the median degree.
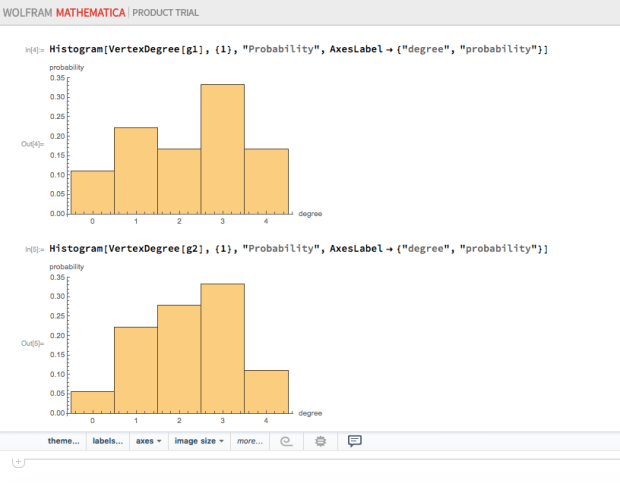
You can see that for both ER graphs, degree 3 has the highest probability- meaning that many nodes have degree 3. Few nodes have degree 0- those are the nodes that are disconnected from the rest of the graph.
We discovered a formula for finding the mean degree of an ER graph. In Mathematica, inputting the command Mean[VertexDegree[g]] (replace g with name of the graph, like g1 or g2 since that’s how we named them) gave us the mean to be 20/9. We realized that 20 is n and 9 is half of m. Thus, the mean degree is n divided by half of m, which can be rearranged to 2n/m– our formula!
Barabási-Albert
Becky has a great analogy for BA graphs! “Think of an Instagram meme page. The more followers that account has, the more likely it is to gain even more followers. This is because the more followers you have, the more likely Instagram will recommend your page to others and the more followers you have, the more likely your followers will tag their friends on your posts hence giving you more exposure.” To summarize, nodes in BA graphs that already have many edges are the most likely to keep gaining edges.
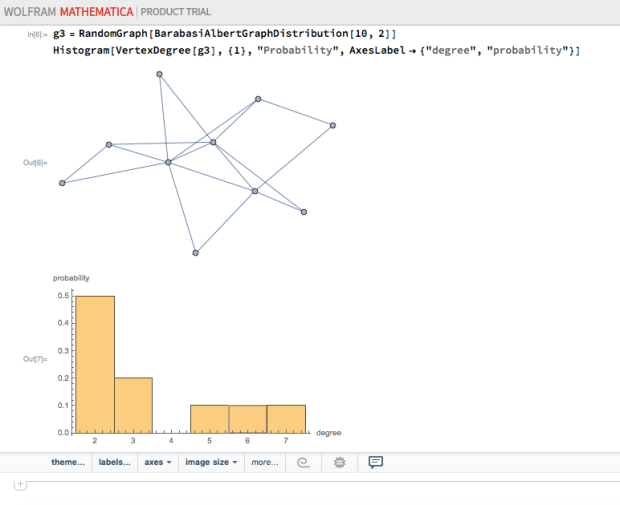
- As you can see, there is a high probability of having nodes with degree 2 and the probability decreases as the degree increases. There is a wide degree distribution, unlike ER graphs.
Network Centrality
We also learned about degree and betweenness centrality that assess how important a node is within its network. A high degree node has a high degree centrality because it is used frequently. Think about recipes- garlic is a common ingredient so as a node, it would have a high degree centrality to show its importance. Betweenness centrality is a bit more complicated. A node’s betweenness centrality shows that node used as a “stop” to other nodes- you can travel through that node to reach a different one, and usually these are short paths of travel.

You may need to zoom in a bit. This map shows that the Gallery Place is an important stop because it lies on the shortest path to many other places, so it has a high degree centrality.
We calculated both types of centrality for some graphs, but honestly, Mathematica did most of the work. Before that, we looked at a small graph (like the one from the first image) and did both calculations by hand. Degree centrality was fairly easy to understand but we had some trouble wrapping our head around betweenness centrality. Mathematica came to the rescue this time!
Community Detection
Groups of similar data points in a graph can tell us more about the data we’re looking at than if the graph appeared entirely random. Community detection is the last thing we learned about- it’s a powerful tool that finds communities in a graph. A “good community structure” exists when there are few edges between different communities, and most of the edges exist within the communities themselves.
For this concept, we downloaded a data set about dolphins. Dolphins are social animals like humans- sarcastic comment here. We learned that if certain dolphins stopped interacting with others, the dolphins would split into different communities to show the lack of interaction.
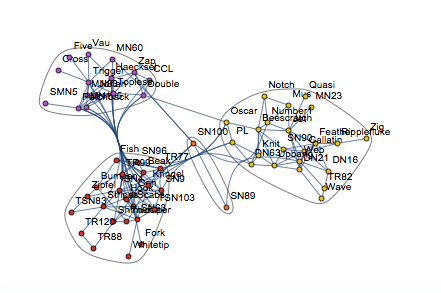
The network shows four different communities and how they are shifted away from each other because some dolphins are no longer interacting with others.
Fan Chung
Fan Chung is a well known mathematician who has contributed greatly to the field of Network Theory. We were given the honour to Skype her and she gave us valuable advice about research, math and life in general. Go listen to our podcast to learn more about her!
Reflection
Girls Talk Math gave us the opportunity to learn about the field of Network Science. At first we thought it might not be that interesting, but as we went through the problem set our interest grew and we ended up liking the topic. This camp also encouraged us to not feel intimidated by advanced mathematics just because we’re young women. The camp has given us so many opportunities, whether it’s launching Barbies off of a bridge or Skyping a famous female mathematician.
About Us
Becky Rozansky and Elizabeth Gross are both rising juniors in high school. Cameron Farrar and Shiropa Noor are rising seniors- please pray for us. Wish us all luck in the upcoming school year, and we hope everyone is having a good summer!

One thought on “Network Science”